
- Series
- Create a pandas Series with the following data: [5, 10, 15, 20, 25] and an index of your choice. Find the sum of the values in the Series.
import pandas as pd

data = [5, 10, 15, 20, 25]
index = [3,4,5,6,7]

df = pd.Series(data, index=index)
print(df)

sum_of_value = df.sum() #or sum(df)
print(sum_of_value)

#we can check the tpye as well
print(type(df))
Output
![Create a Pandas Series with the following data: [5, 10, 15, 20, 25] and an index of your choice. Find the sum of the values in the Series.](https://programmingdoor.com/wp-content/uploads/2023/11/image-4.png)
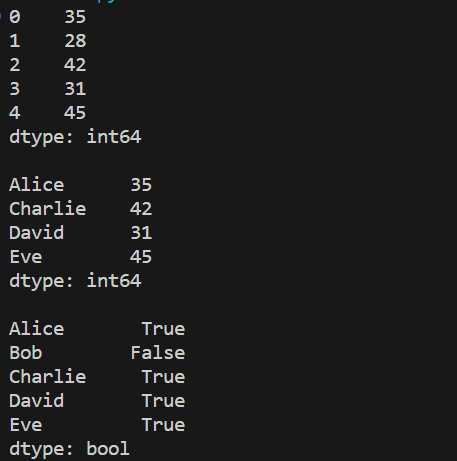
- Create a Series containing the ages of a group of people and an index of their names. Select and display the ages of individuals who are older than 30.
import pandas as pd

ages = [35, 28, 42, 31, 45]
names = ['Alice', 'Bob', 'Charlie', 'David', 'Eve']

df= pd.Series(ages)
print(df,end="\n\n")

df = pd.Series(ages,index=names)
print(df[df>30], end="\n\n") #values

print(df>30) #True or False
Output
- Create a Series with the temperatures in degrees Celsius for a week. Convert the temperatures to degrees Fahrenheit (Fahrenheit = Celsius * 9/5 + 32).
import pandas as pd
tempretur = [33,35,28,36]

celcius = pd.Series(tempretur)

print(celcius)

# Convert Celsius temperatures to Fahrenheit
fahrenheit_temperatures = celcius * 9/5 + 32
print(fahrenheit_temperatures)

#or

for temp in celcius:
    Fahrenheit = temp * 9/5 + 32
    print(f"Fahrenheit {Fahrenheit} for Celcius Tempreture {temp}")
Output

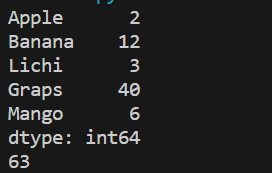
- Create a Series with a list of your favorite fruits and another Series with the number of each fruit you have. Calculate the total number of fruits you have.
import pandas as pd

fruits = ["Apple","Banana","Lichi","Graps","Mango"]
Quanity = [2,12,3,40,6]

series = pd.Series(Quanity, index=fruits)
print(series)
total_quantity = series.sum()
print(total_quantity)
Output
- Create a Series with student names as the index and their exam scores. Find the mean score and list the students who scored above the mean.
import pandas as pd

students = {"Rajnish":80,"Manish":70,"Amit":70,"Prince":75}

series = pd.Series(students)

mean_scope = series.mean()
print(mean_scope)

above_mean = series[series>mean_scope]
print(above_mean)
Output

- DataFrame
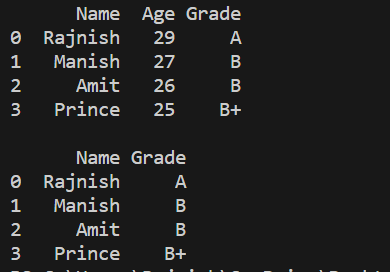
- Create a DataFrame from a dictionary with information about students (Name, Age, Grade). Select and display only the “Name” and “Grade” columns.
import pandas as pd

students = {"Name":["Rajnish","Manish","Amit","Prince"],
            "Age":[29,27,26,25],
            "Grade":['A','B','B','B+']
            }

df = pd.DataFrame(students)
print(df, end="\n\n")

selected_columns = df[["Name","Grade"]]
print(selected_columns)
Output
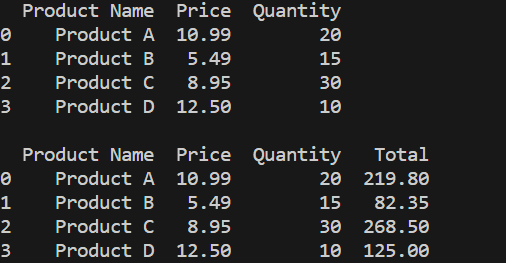
- Create a DataFrame with information about products (Product Name, Price, Quantity). Add a new column “Total Price” that represents the product of Price and Quantity for each product.
import pandas as pd

data = {
    'Product Name': ['Product A', 'Product B', 'Product C', 'Product D'],
    'Price': [10.99, 5.49, 8.95, 12.50],
    'Quantity': [20, 15, 30, 10]
}

df = pd.DataFrame(data)

print(df, end="\n\n")
df["Total"] = df["Price"] * df["Quantity"]
print(df)
Output
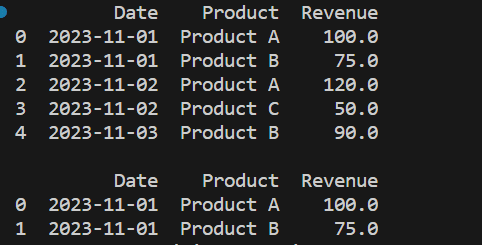
- Create a DataFrame with sales data, including columns for “Date,” “Product,” and “Revenue.” Filter the DataFrame to show sales data for a specific date.
import pandas as pd

data = {
    'Date': ['2023-11-01', '2023-11-01', '2023-11-02', '2023-11-02', '2023-11-03'],
    'Product': ['Product A', 'Product B', 'Product A', 'Product C', 'Product B'],
    'Revenue': [100.0, 75.0, 120.0, 50.0, 90.0]
}

df = pd.DataFrame(data)
print(df,end="\n\n")

specific_date_data = df[df["Date"]=="2023-11-01"]

print(specific_date_data)
Output
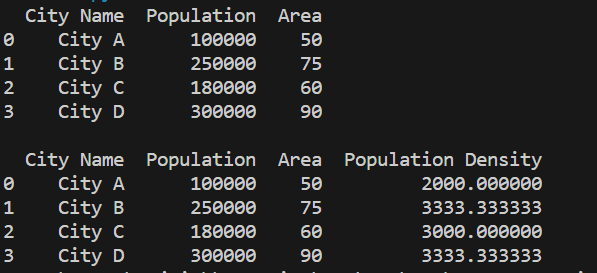
- Create a DataFrame with information about cities (City Name, Population, Area). Add a new column “Population Density” calculated as Population/Area.
import pandas as pd

data = {
    'City Name': ['City A', 'City B', 'City C', 'City D'],
    'Population': [100000, 250000, 180000, 300000],
    'Area': [50, 75, 60, 90]
}

df = pd.DataFrame(data)
print(df,end="\n\n")

df["Population Density"] = df["Population"]/df["Area"]
print(df)
Output
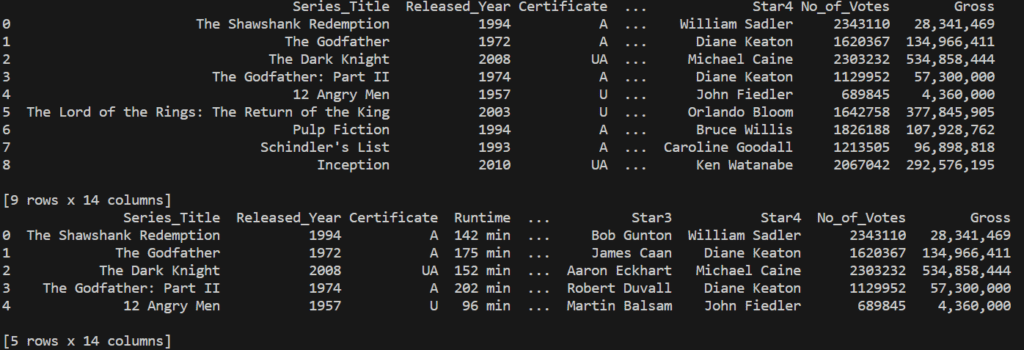
- Create a DataFrame from a CSV file containing information about movies (Title, Genre, Rating). Select and display the movies with a rating higher than a certain threshold.
import pandas as pd

df = pd.read_csv("Data Structure/movies.csv")
print(df)

threshold = 8

df = df[df["IMDB_Rating"]>threshold]
print(df)Output


Informative content l, thanks alot